This article mainly introduces how to use freedom studio to debug the run_led project.
Related reference articles:
RISC-V teaching plan
1. Engineering debugging
- Add BreakPoint
- Double-click line number 23 in the run_led.S editing window, and you can see that there is a blue dot on the left side of the line number. It means that the breakpoint is successfully added on line 23, as shown in Figure 1

Figure 1 Add break point
- In the Breakpoints window, you can see the breakpoint (line23) just added, as shown in Figure 2

Figure 2 Breakpoints window
- In the Debugger Console window, you can see that the program stops at the break point (line23) we just added, as shown in Figure 3

Figure 3 Debugger Console window
- Looking at the target board, you can see that the marquee is parked on an LED (LED3 in this example). Prove that the breakpoint was added successfully, as shown in Figure 4

Figure 4 LED3 lights up
- View the register window
- The pc value is 0x80000038, which proves that the jump statement JAL LOOP has not been executed.
- The value of the register s2 corresponding to x18 has been modified to 0xfffffff7, and the corresponding LED3 is lit, proving that the previous statement NOT x18, x10 has been executed.
- For the ABI related information on various pointers, saving registers and temporary registers in the RV32I register, please refer to the document: RISC-V-spec P28 Figure 2.4, or refer to the article: RISC-V Assembly Language Programming (4) Assembly Language Format and ABI
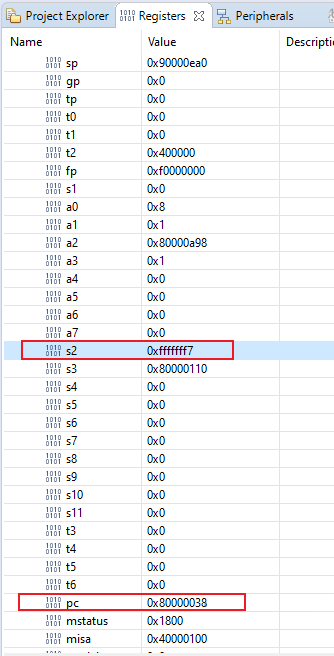
Figure 5 register window
- Resume (resume running)
- After interrupting the program, click the resume icon above to continue running the program, as shown in Figure 6

Figure 6 Continue to run
-
- It can be seen that after the program runs the loop, it stops at the previously set breakpoint position.
- Looking at the register window again, you can see that the value of s2 has been changed to 0xffffffffb.
- The LED2 light on the target board is lit, and the LED light is moved one position to the right. The result is consistent with the information displayed in the window, as shown in Figure 7
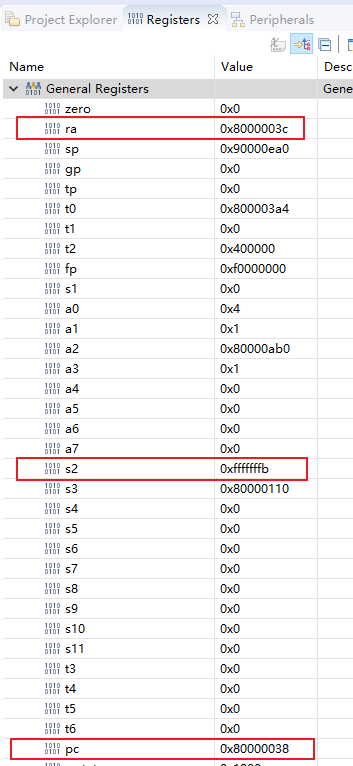
Figure 7 register window
- single step
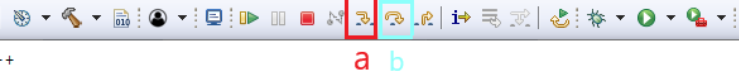
Figure 8 Single Step Button Icon
a : Step Into (jump into the function body)
b : Step Over (skip function body)
-
- The assembler used in this example has no functions, so both icon buttons can be used as single-step
- Click the jump into function body icon to step through
- In the Register window, you can see that the pc value has been changed to 0x8000001c
Note: The register modified in the previous step will be highlighted in yellow
-
- The blue pointer icon points to line number 14, which proves that the program single-steps the JAL LOOP statement and jumps to the starting position of the LOOP, as shown in Figure 9

Figure 9 Edit window
- View the Disassembly window
- Open the Disassembly (disassembly) window and you can see that the blue indicator points to the statement addi t1,t1,1 which is the first statement of LOOP, as shown in Figure 10
Note: Individual statements are different from the original assembler because of optimizations made during GCC compilation.

Figure 10 Disassembly window
- Click Step Into again, and you can see that the pc value is changed to 0x80000020, as shown in Figure 11, the indicator icon points to BNE x6, x7, and LOOP is shown in Figure 12
- The value of t1 is modified to 0x1, which proves that the command ADDI x6, x6, 1; on line 14 is executed, and the single-step execution is successful
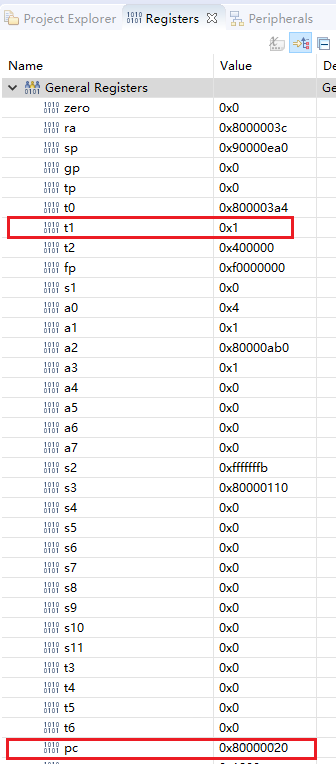
Figure 11 Resigter window

Figure 12 Disassembly window
- In the Disassembly window, you can see that the indicator icon points to bne t1, t2, 0x8000001c; it is consistent with the original program pointer, as shown in Figure 13

Figure 13 Disassembly window
- Click Step Into, the program pointer jumps back to line 14, and the PC value is changed to 0x8000001c
- The reason is that the value of x6 (t1) in the previous statement is 1, x6!= x7 , so the program still runs in the loop loop, as shown in Figure 14

Figure 14 Edit window
- If you need to run directly to the next step, you can double-click the line number 16 to add a break point.
- Click Resume , the program will automatically run and pause at the instruction on line 16, as shown in Figure 15

Figure 15 Adding a breakpoint on line 16
- So far, the debugging of the run_led project is completed