This article mainly introduces how to use freedom studio to debug the run_seg project.
Related reference articles:
RISC-V teaching plan
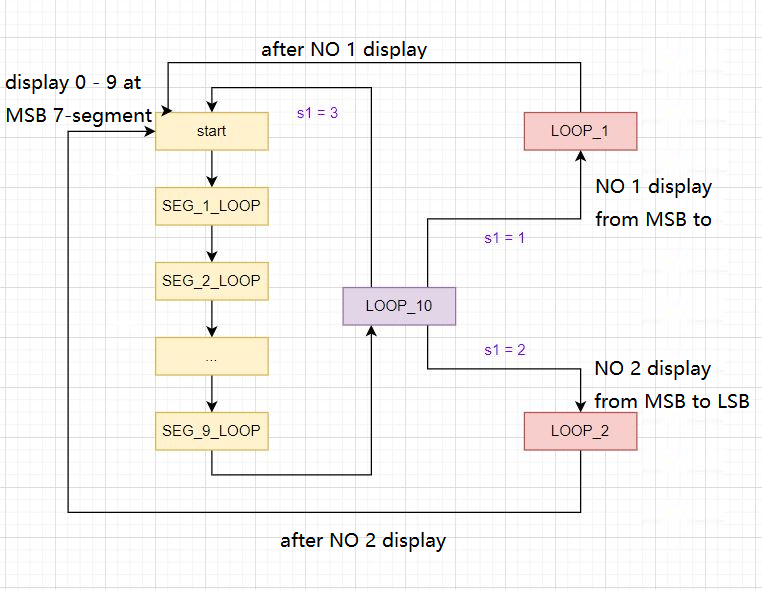
The original block diagram of the run_seg project is shown in the following figure:
The expected experimental phenomenon of the run_seg project is as follows:
1. Create the run_seg project
- Copy the project file, as shown in Figure 1
- Right-click the project file run_led and click copy in the pop-up menu bar
- Right-click an empty space in the project list and click paste
- The Copy Project dialog box pops up , change the project file name in the Project name column (it is recommended to change to run_seg here ), check the default address for the storage address, and click OK to confirm
- The files contained in the newly created project file run_seg are exactly the same as the run_led project

Figure 1 New run_seg project
- Copy the assembly file run_seg.S to the run_seg project folder, as shown in Figure 2

Figure 2 Copy the run_seg.S file
- Refresh the project, as shown in Figure 3
- Right-click in the project area, select the run_seg project, and click Refresh
- After refreshing, you can see the newly added file run_seg.S
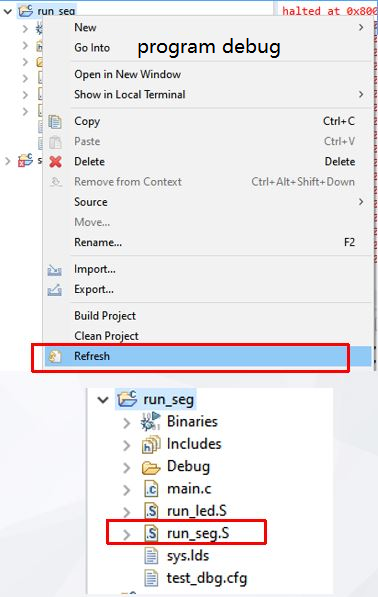
Figure 3 The run_seg.S file appears in the workspace after refreshing
- Delete the run_led.S file
- Right-click run_led.S , click Delete to delete the run_led.S file, and click OK to confirm in the pop-up window

Figure 4 Delete the run_led.S file
- project compilation
- Right-click on the run_seg project name, and click Build Project in the pop-up menu. The following result appears in the Console window, indicating that the project was compiled successfully, as shown in Figures 5 and 6

Figure 5 build project

Figure 6 Console display
2. Engineering debugging
- software burning
- Right-click on the run_seg project and select: Debug As ->Debug Configuration to open the Debug Configuration window, as shown in Figure 7

Figure 7 Project debugging configuration
-
- Create a new launch configuration in debug
- Click to select GDB OpenOCD Debugging , click the icon in the upper left corner to create a new burning configuration, as shown in Figure 8

Figure 8 New GDB OpenOCD Debugging
- set debug
- Change the burning configuration name to run_seg Debug (generally the default is the name of the current project + Debug)
- Add the run_seg.elf file path, as shown in Figure 9
- After setting, click Apply

Figure 9 Debug settings
-
- Set up Debugger , as shown in Figure 10
- Add config options -f test_dbg.cfg in Config options
- After setting, click Apply
- Set up Debugger , as shown in Figure 10

Figure 10 Debug settings
-
- Set Startup , as shown in Figure 11
- Check Set Program counter at (hex) and enter 80000000
- After setting, click Apply
- Set Startup , as shown in Figure 11

Figure 11 Debug settings
-
- After all settings are completed, click debug to burn the project
- Double-click run_seg.S to view the code, as shown in Figure 12

Figure 12 Code editing area
- So far, observe the experimental phenomenon as shown below, and find that both loop_1 and loop_2 set in the program are not executed correctly
3. Correct the run_seg project
- Loop_1 , use the number 1 on the nixie tube to perform a one-way marquee from left to right
- Loop_2 , use the number 2 on the nixie tube to perform a one-way marquee from left to right

Figure 13 run_seg.S
- Set a breakpoint at BEQ s1,ra,LOOP_1 (line 189) as shown in Figure 14

Figure 14 Setting breakpoints
-
- Click the Terminate icon to terminate the program
- Click the Debug icon to terminate the program
- The program pauses at the added breakpoint, as shown in Figure 15

Figure 15 Breakpoint display
- View the value in the corresponding register
- The value of ra is 0x800001fc , which is inconsistent with the initial setting of 0x00000001 , as shown in Figures 16 and 17

Figure 16 Setting the initial value of ra

Figure 17 The value of ra after being changed
- Add a breakpoint at JAL SEG_1_LOOP (56 lines of code), as shown in Figure 18
- Click the Terminate icon to terminate the program
- Click the Debug icon to terminate the program
- The Register window shows that the value of ra has not been changed before the execution of the statement JAL SEG_1_LOOP, which is 0x00000001 previously set , as shown in Figure 19

Figure 18 Add a breakpoint

Figure 19 The value of ra has not changed
- Click Step into to step through
- In the Register window, you can see that the value of ra is changed to 0x8000005c after the JAL SEG_1_LOOP statement is executed , so it can be confirmed that the statement changed the value of ra, as shown in Figure 20
- By looking at the documentation, it can be seen that the JAL instruction will change the value of ra

Figure 20 The ra value is modified by the JAL instruction
-
- Replace the ra register in the program with the s2 register ( LI s2 on line 33, 0x00000001 and BEQ s1,s2,LOOP_1 on line 189 )
- Save the modified program
- Experiment on the board again, and found that after using the numbers 1 and 2 on the digital tube to move the one-way marquee once from left to right, it cannot be repeated, as shown below
- Looking at the code in LOOP_10, it is found that after s1 continues to increase from 1 to 3, it jumps to start, and then cannot return to LOOP_1 and LOOP_2, as shown in Figure 21
- The modified code is shown in Figure 22, which can be repeated on the digital tube with numbers 1 and 2 to move the one-way marquee from left to right

Figure 25 The value of s1 continues to increase by 1

Figure 26 Modified program
- Save the modified code, recompile, run, and the results are shown below